Screenshots
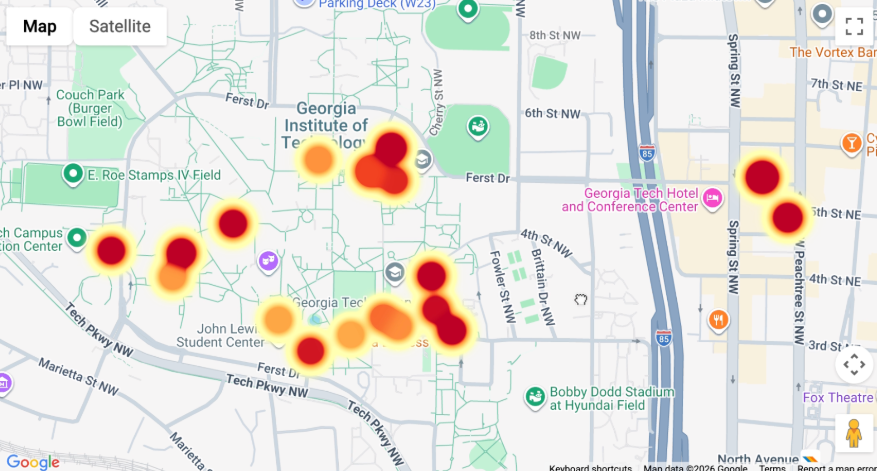
A crowdsourced internet speed mapping application for the Georgia Tech campus — letting students run speed tests from any building and visualizing the results as a live heatmap to show where campus WiFi is fastest and slowest.
Georgia Tech doesn't publicly share WiFi performance data across campus — so students have no way to know which buildings have the fastest or slowest internet. GT WiFi Watch fills that gap: a web application where students run a speed test from wherever they are on campus, and the results are plotted on a live Google Maps heatmap for everyone to see.
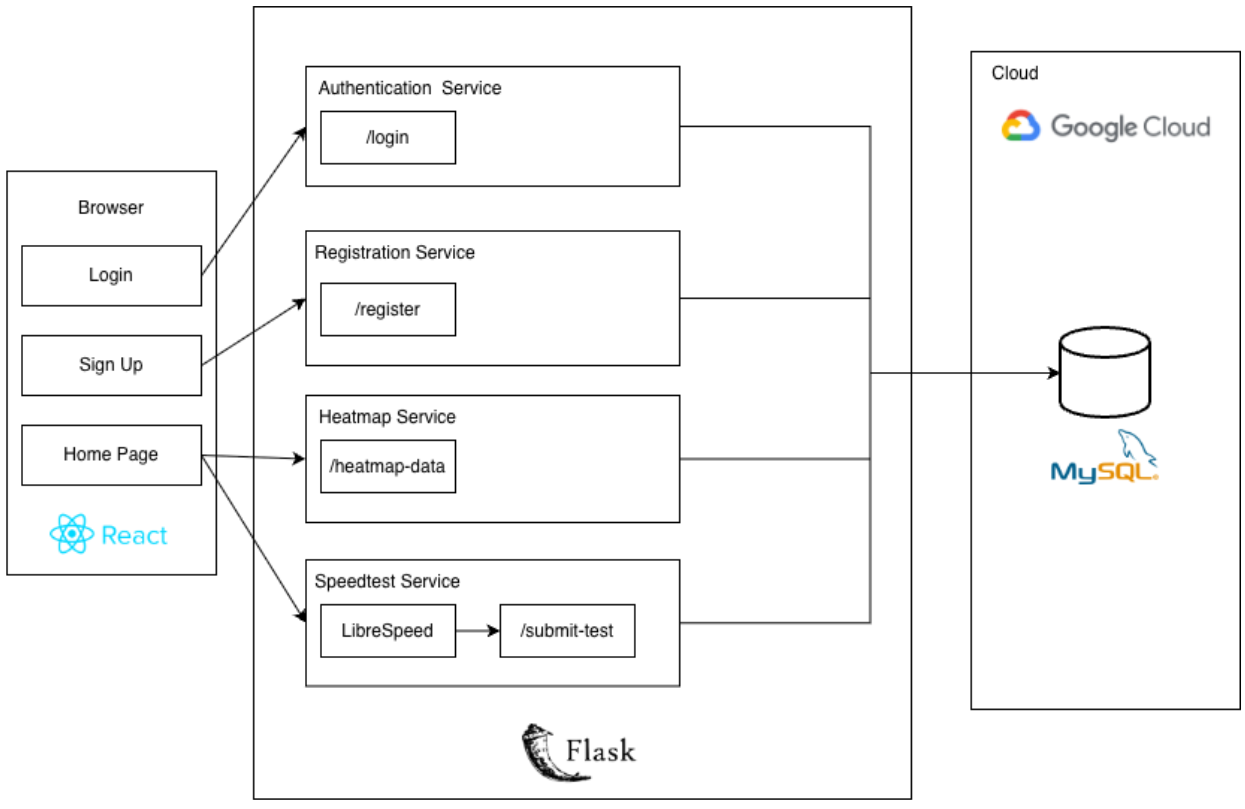
The project was built by a 5-person team for a CS course at Georgia Tech, using a React frontend, Flask backend, MySQL database hosted on Google Cloud Platform, and LibreSpeed as the browser-based speed testing engine. The key technical challenge was accurate location detection — standard geolocation APIs had 1,000+ meter error, so we switched to browser GPS and built a custom building identification system using GeoJSON footprints and polygon matching.
Geolocation & Building Identification (Seth) Built the geolocation pipeline — switching from the Google Geolocation API (which had ~946m error) to the browser's native GPS API, which achieved ~35m accuracy. The Flask backend then matches GPS coordinates against a local GeoJSON file of Georgia Tech building footprints using Shapely, identifying exactly which building the user is in and saving it with the speed test result.
Speed Test Engine Integrated LibreSpeed as the browser-based testing engine, deployed in a Docker container on a Google Cloud Platform virtual machine. The system measures latency, download speed, and upload speed in real time, displaying live results in the React frontend before submitting to the Flask backend.
Live Heatmap Built a deck.gl heatmap overlay on Google Maps that plots all submitted speed tests by GPS coordinates, color-coded by download speed (red = fast, yellow = slow). The heatmap re-fetches data on every new submission and supports time-window filtering so users can see recent data vs. all-time.
GT Network Verification Implemented a network verification system that checks whether a user is actually on GaTech WiFi before accepting a speed test — extracting the IP address from the LibreSpeed response and making a GET request to ipinfo.io to verify the organization is Georgia Tech. Also handles VPN detection.
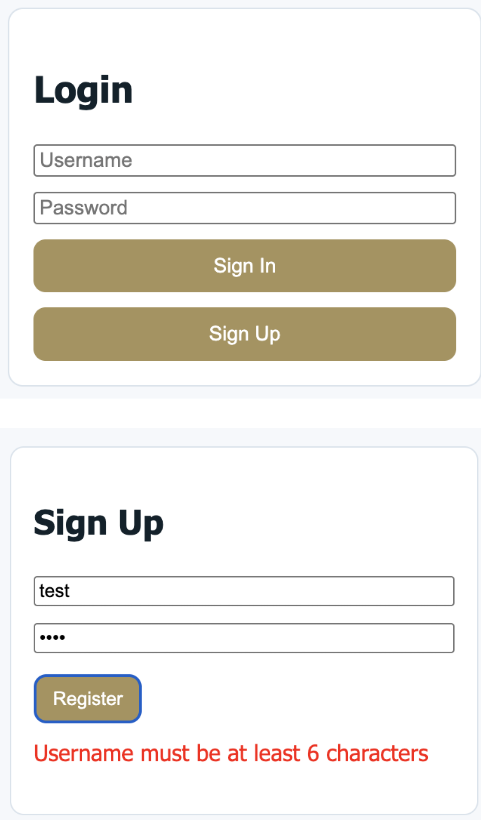
Authentication & Session Management User credentials are stored with Werkzeug password hashing. Sessions are managed via sessionStorage — logging out or closing the browser ends the session automatically.
MySQL Database on GCP Designed a 3-table relational schema: User (login info), Speedtest (test results with ping/jitter/upload/download), and Geolocation (GPS coordinates + matched building name, linked to Speedtest by foreign key). Hosted on Google Cloud Platform with 44 speed test entries collected across campus.
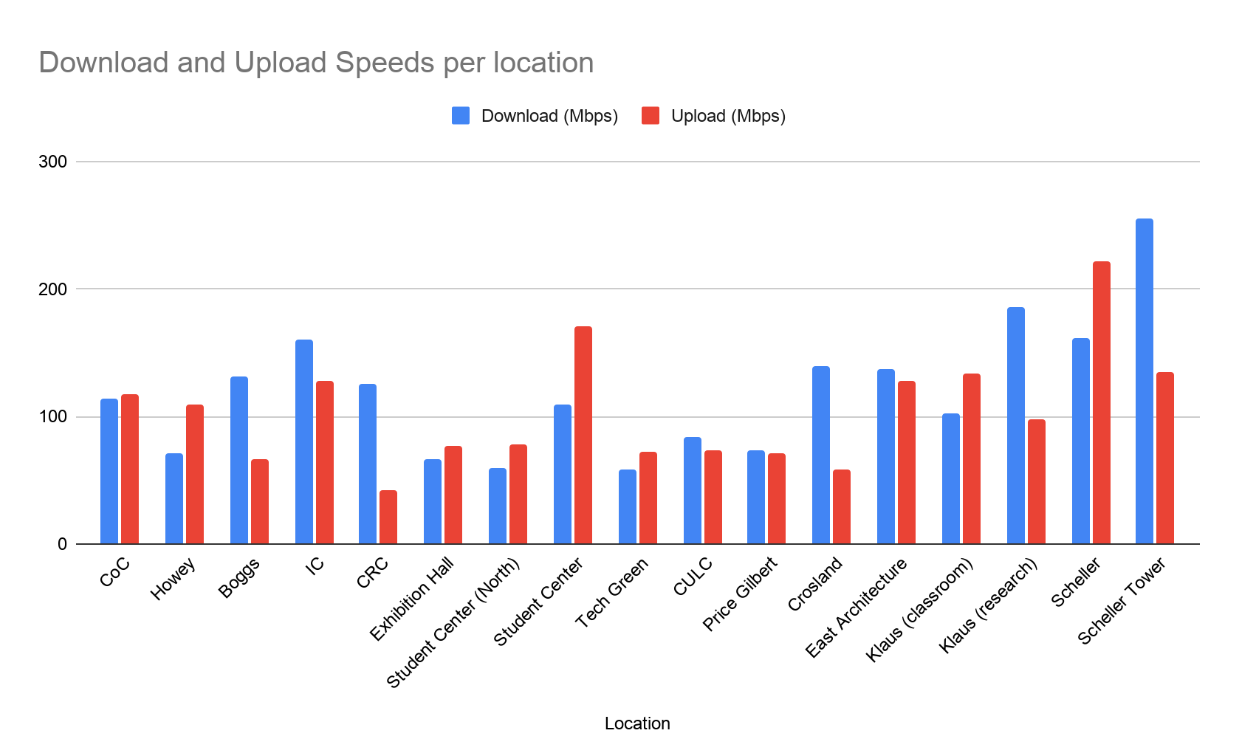
The team collected speed test data across 17 campus buildings, ran comparison experiments against Ookla, and tested how speeds vary by time of day. A few highlights:
Scheller Tower (newest on campus, opened Spring 2026) had the highest download speeds — likely due to newer networking infrastructure.
Student Center and CRC had the lowest speeds — consistent with being the highest-traffic locations on campus during afternoon hours.
Speeds were approximately 30–36% faster at 10PM vs afternoon, confirming that campus network congestion is a major factor.
Buildings at campus edges (Scheller: 1m error) were far more accurate than central buildings near Tech Green (Crosland: 88m error) due to competing WiFi signals.